Introduction
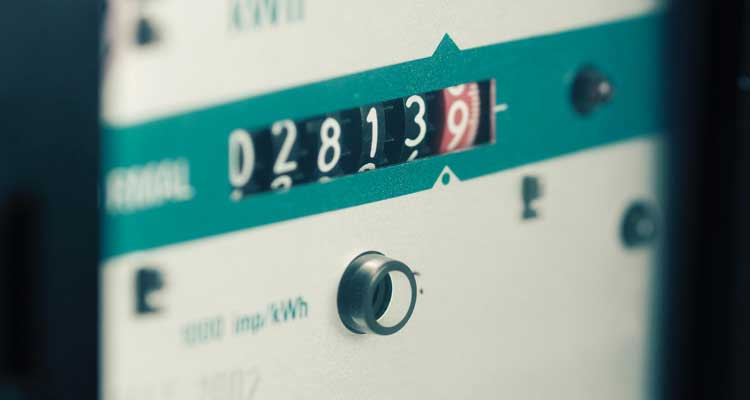
The process of traditional sub-meter reading involves the deployment of trained personnel by the organization to survey every single house and other properties in their list to note down consumption metrics. This data is later aggregated manually and bills prepared to be sent to the respective consumers for further perusal.
A handful of limitations and potential drawbacks to this existing process have a direct impact on cost borne by the organization and level of convenience experienced by the consumer. The following article is about how newer technologies in the domain of Computer Vision and Optical Character Recognition (OCR) can be leveraged to make the process cost-effective and streamlined.
Contemporary challenges and the need for innovation
Sub-metering has been an essential part of utility management through decades to avoid both underestimating and overestimating consumption metrics from electricity meters, water meters, etc. Albeit there have been improvements in Internet of Things (IoT) technologies over the years in the Fourth Industrial Revolution, meter reading has seldom been thought of as priority primarily due to the high robustness of the currently deployed devices across buildings.
Some of the challenges which organizations and consumers regularly experience are as follows:
- Representatives have to take manual readings from the meters and collect them into a centralized spreadsheet which is not only ineffective but also costly
- Meters can get dirty or even damaged over time making it prone to inaccurate readings and even sometimes frustrating for the representatives
- Multiple versions of the same data may exist due to error discovered after the readings have been logged
- Paper bills are still prevalent which raises the risk of human error across the pipeline and disputes raised by the consumers
- Due to unavailable integration with current systems, after the bills are finally paid, there is a disconnect between how the status of the payment is updated in the company’s accounting management software
- There is limited usage transparency for tenants and a lack of software which provides a statistical analysis of usage data which could be useful in cutting down waste and costs
- Poor data collection standards and quality causes losses of more than a trillion dollars in the US per year
An aggregate of all the challenges listed above has a direct impact both in terms of costs and convenience. While it need not be necessary to replace installed units with newer ones causing even more delay in regaining costs, the process can be certainly made even more robust in terms of what data is collected and how is it collected.
Automating the traditional sub-meter reading process
Workflow design
- All the consumers and representatives of the organization are provided with a cross-platform mobile application through which they can manage sub-meter readings
- A picture of the meter is taken and the quality of the image is checked using computer vision techniques for further perusal
- If the image quality is above the recommended threshold, then the image is uploaded to the organization’s database, else the consumer is requested to take another image or raise a complaint to be followed up by the organization.
- The allowed images are then processed for extracting the reading values (numeric) and ID (alphanumeric, barcode, etc.) of the meter
- This numerical data is then used to calculate the amount owed by the consumer and an e-bill is generated which is forwarded to them via email.
To summarize -
Benefits
- The data can now be collected by the consumers themselves with no prior requirement to have knowledge of how to read sub-meters
- Representatives (if and when required) need not struggle with reading meters
- Organizations can redirect personnel to carry out more important tasks and save time
- The amount of money saved can be used to upgrade the existing system of devices
- Consumers can keep track of their usage metrics, allowing for transparency and reducing situations of dispute
- Existing mobile devices can be repurposed as a replacement for dedicated devices as training is seldom required when individuals are used to using smartphones
Challenges and shortcomings
- Font sizes lesser than 12 points can result in inaccuracies in the predicted output.
- If the quality of the image is poor (low resolution, blurred, etc.), OCR engines give inconsistent and unreliable outputs making it harder to perform OCR using mobile devices or experience operations delay when new images are required later.
- When images are captured in dark environments, a lot of pre-processing is required which at most times leads to the loss of information and ultimately poorer OCR performance.
- If the texts are sparse i.e. with no proper structure and complex background, simple OCR techniques fail to recognize texts correctly and efficiently.
- Having more unrequited text in the background also leads to poorer performance.
- It is not necessary that readily available models are able to detect texts correctly primarily due to the type of dataset on which the model was trained on. Model retraining on a new dataset which is expected to be large in size can have computational overheads which ultimately slows down the process and leads to an inefficient pipeline.
- Data is not readily available unless purposefully collected over time through either the efforts of the organization or crowdsourcing. Moving further, it is also necessary that the datasets are labeled with low human error to ensure that the model is trained correctly. Frequent errors can poorly train the model and debugging is not possible until the final model is tested which can take a lot of time and effort.
Go-to deep learning approaches - Text Detection & Recognition
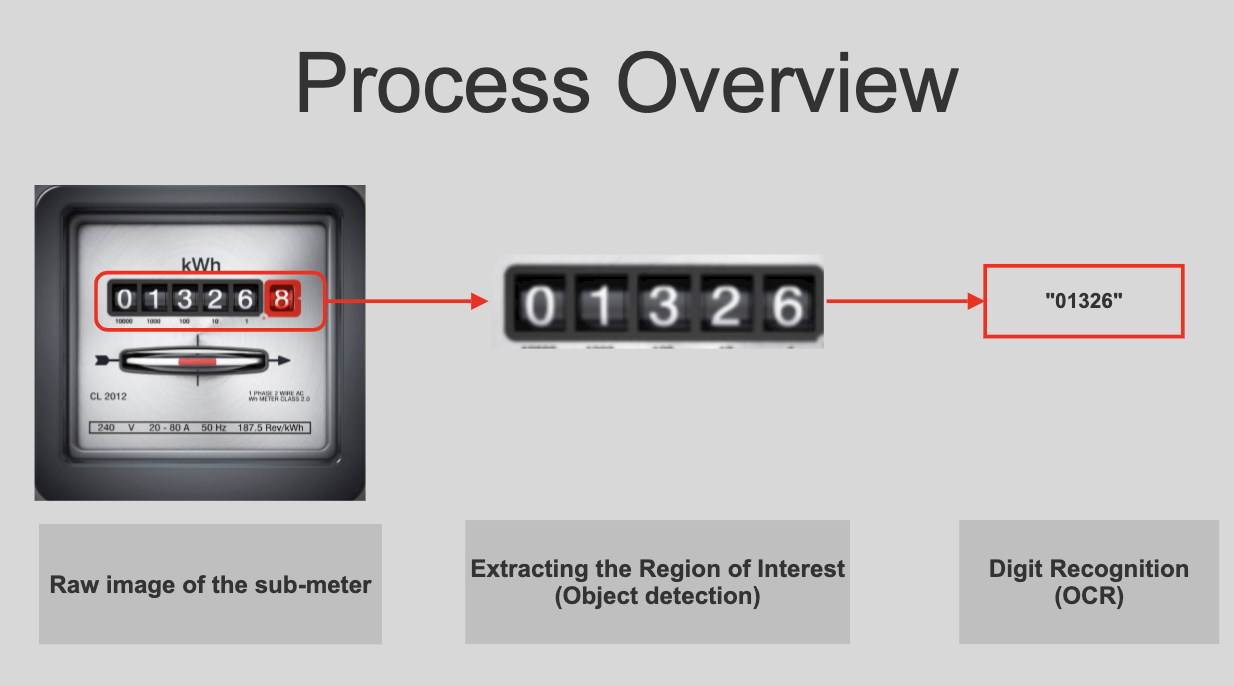
The process of getting the values from the images of the meter is two-fold. First, we need to detect the areas where the text is and extract the coordinates of the bounding box. This cropped area is then passed through a text recognition algorithm to give us the final output.
Detecting Area of Interest
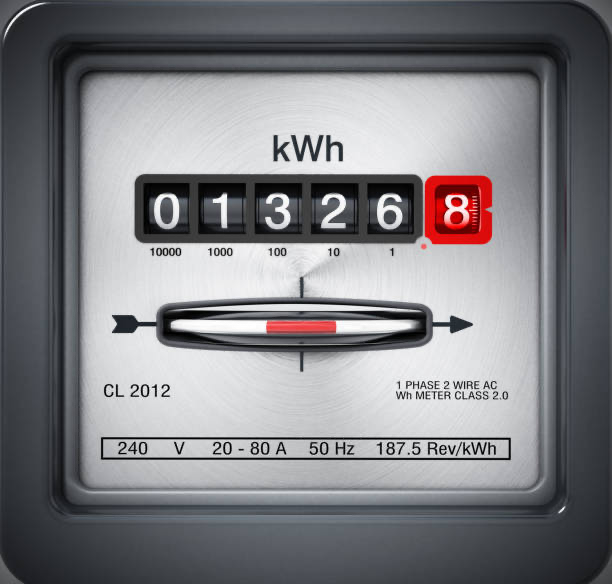
Say we have to develop a methodology to read the numbers from the above meter. This means that intuitively, our region of interest is the dark animated area, which implies that the rest of the text is of no use to us. There are two ways to detect whether the area recognized by our algorithm is of interest to us or not - Single Shot Detectors, and Region Based Detectors. We describe three deep learning architectures to accomplish this.
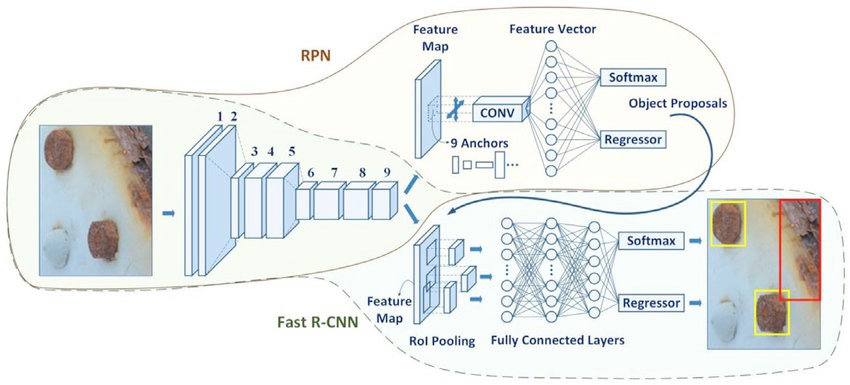
1. Region Based Detectors
Region Based Detectors first form a set of all probable regions from the given image, and then passes the image through a classifier to figure out whether it contains text or not, or more importantly, the readings. Popular CNN (Convolution Neural Network) based algorithms which follow this methodology are R-CNN, FastR-CNN and FasterR-CNN. They are slower as compared to Single Shot Detectors but gives out results with higher accuracy.
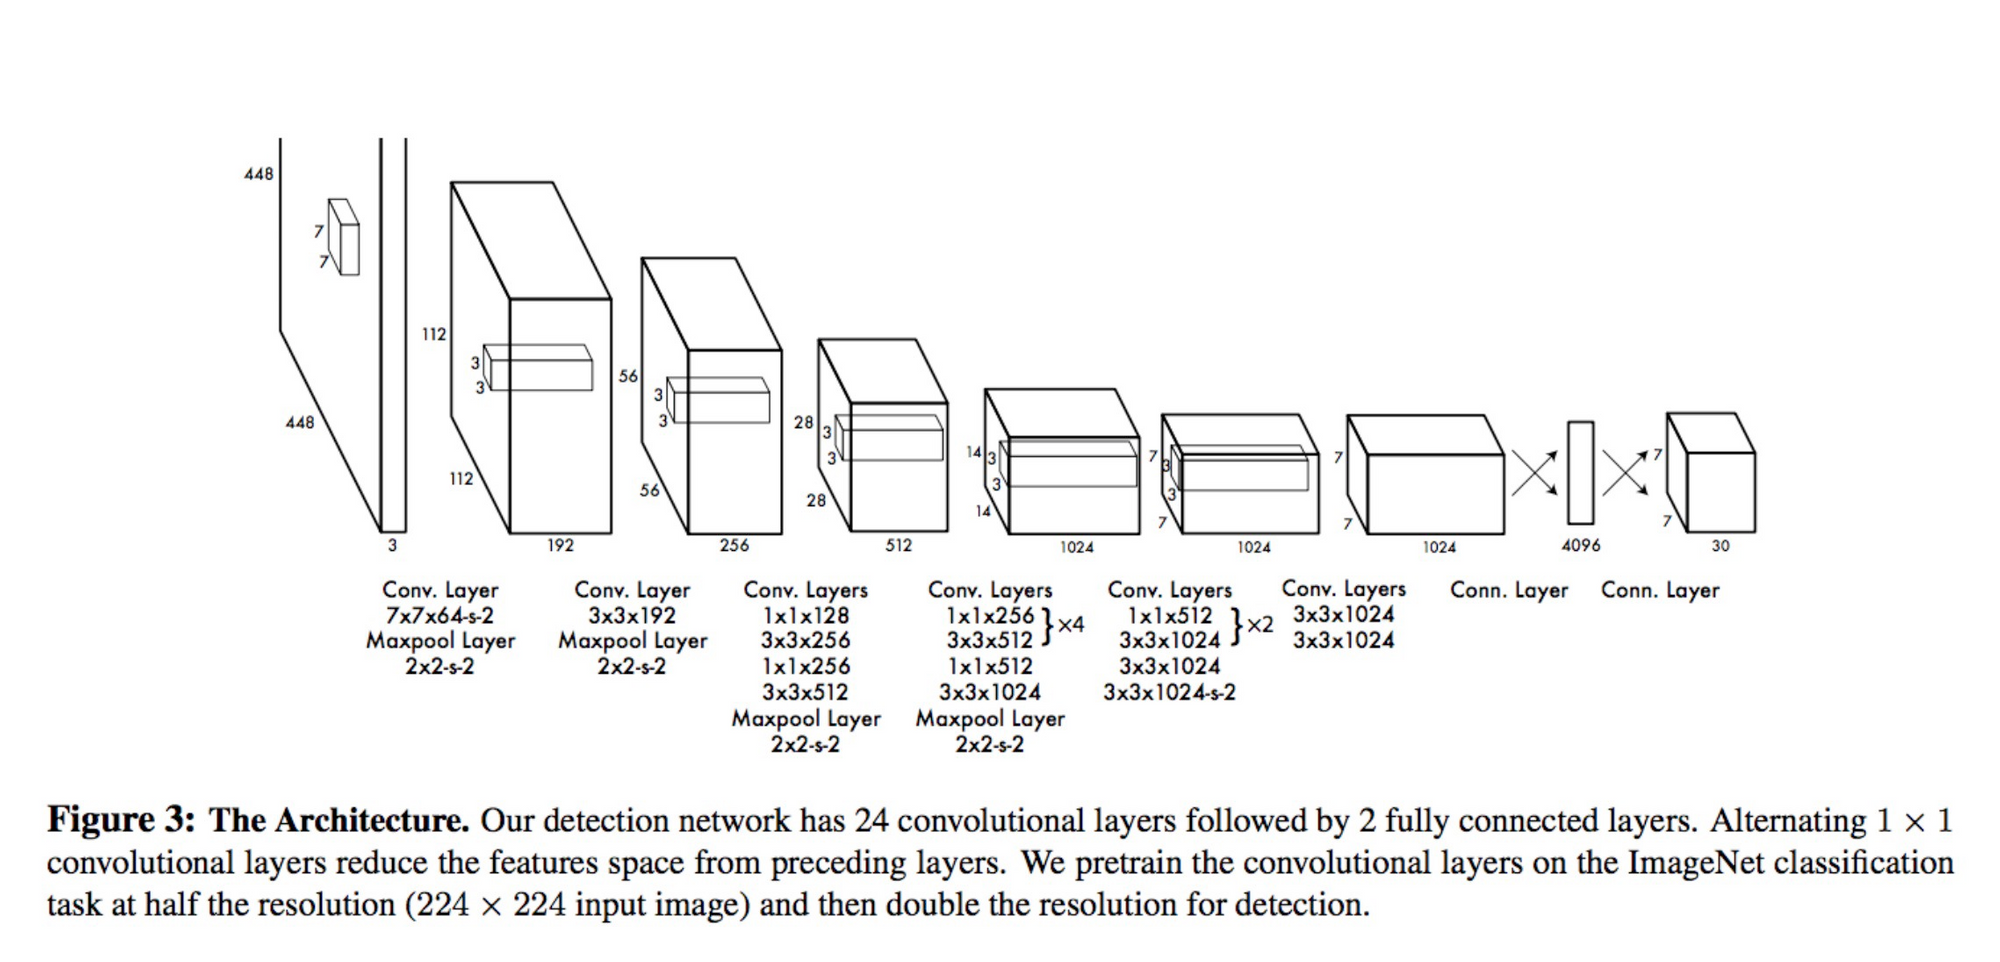
2. Single Shot Detectors
Single Shot Detectors detects the boundary box and classifies the region at the same time. Since, it is a single step process, it is much faster than Region Based Detectors. It must be noted, that Single Shot Detector perform poorly when dealing with small sized objects. Luckily for our case, readings generally have larger fonts as compared to other text on the meter. This way Single Shot Detectors are an idea fit. Popular algorithms which follow this methodology as YOLO (You Only Look Once) and SSD (Single Shot multibox Detector).
3. EAST (An Efficient and Accurate Scene Text Detector)
While Single Shot and Region Based Detectors deliver good performance with respect to the task of Object Detection, it'd be great to get the best of both worlds by not only receving results at nearly real-time speeds, but also obtain state-of-the-art accuracies while doing so.
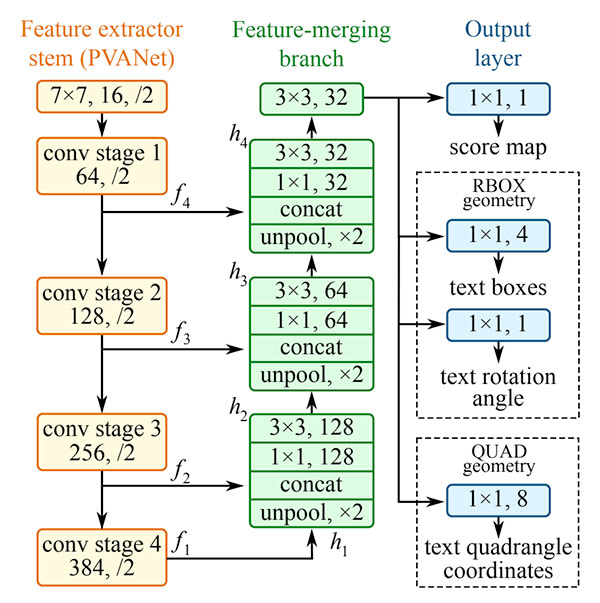
EAST detects texts from images and provides geometry and confidence scores for each block of text it detects.
- The geometry of the the boundary box is given by offset point = (offsetX, offsetY), top, right, bottom and theta.
- Top is the distance between the top of the bounding box and the offset point.
- Bottom is distance between the bottom of the bounding box and the offset point.
- Right is the distance between the right of the bounding box and the offset point.
- The rectangle is rotated about the offset point by theta radians.
After performing this step, a region of interest for the image above looks something like -

Next step is to detect individual digits from this region of interest. Popular open-source OCR Engines like Tesseract have achieved good results. Another effective deep learning architecture called Convolution Recurrent Neural Network is described below.
Digit Extraction
Convolutional Recurrent Neural Network (CRNN)
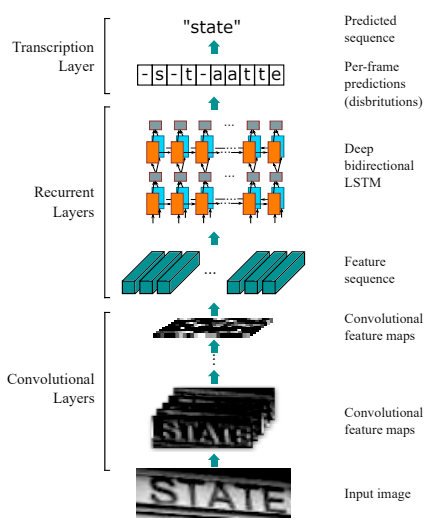
The pre-processed image is fed the the network in which the first layer is comprised of a Convolutional Neural Network which divides the image into feature columns, i.e., convolutional feature maps and then fed into a bi-directional LSTM sequence as a feature sequence. This recurrent neural network is responsible for outputting a sequence, intended for finding relations between characters. Finally, the output sequence which now consists of characters which may or may not have significance is passed onto the Transcription Layer, in which these characters are unified using a probabilistic method to extract information from the sequence.
The code snippet below does the two step process using OpenCV and Tesseract.
image = cv2.imread("meter_1.jpg")
gray_image = cv2.cvtColor(image, cv2.COLOR_BGR2GRAY)

# performing Canny edge detection to remove non essential objects from image
edges = cv2.Canny(gray_image, 400, 300, apertureSize=3)
# since findContours affects the original image, we make a copy
image_ret = edges.copy()

# converting image to binary
ret, thresh = cv2.threshold(image_ret, 127, 255, 0)
# getting the contours
contours, hierarchy = cv2.findContours(thresh, cv2.RETR_EXTERNAL, cv2.CHAIN_APPROX_NONE)

digits = dict()

# getting bounding boxes having a minimum area
# this large area is surely to contain the output values
for (i, c) in enumerate(contours):
  if cv2.contourArea(c)>10000:
    (x, y, w, h) = cv2.boundingRect(c)
    roi = thresh[y:y + h, x:x + w]
    digits[i] = roi
    break

cv2_imshow(digits[i])

# we just need the numbers
custom_config = r'--oem 3 --psm 7 outbase digits'
print(pytesseract.image_to_string(digits[i], config=custom_config))
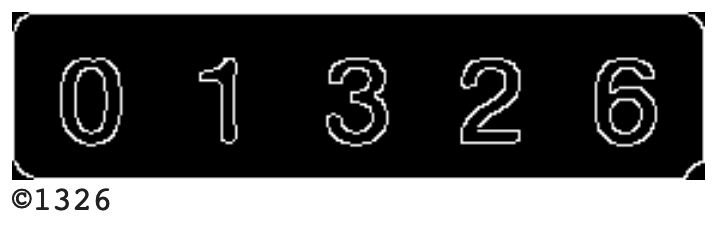
Pretty cool. But not good enough. As the image above indicates, the extracted portion - 01326 is read as ©1326. What if you could make more accurate models with significantly lesser efforts?
OCR with Nanonets
The Nanonets OCR API allows you to build OCR models with ease. You can upload your data, annotate it, set the model to train and wait for getting predictions through a browser-based UI.
1. Using a GUI: https://app.nanonets.com
2. Using NanoNets API: https://github.com/NanoNets/nanonets-ocr-sample-python
A step-by-step guide to training your own model using the Nanonets API -
Step 1: Clone the Repo
git clone https://github.com/NanoNets/nanonets-ocr-sample-python
cd nanonets-ocr-sample-python
sudo pip install requests
sudo pip install tqdm
Step 2: Get your free API Key
Get your free API Key from https://app.nanonets.com/#/keys
Step 3: Set the API key as an Environment Variable
export NANONETS_API_KEY=YOUR_API_KEY_GOES_HERE
Step 4: Create a New Model
python ./code/create-model.py
Note: This generates a MODEL_ID that you need for the next step
Step 5: Add Model ID as Environment Variable
export NANONETS_MODEL_ID=YOUR_MODEL_ID
Step 6: Upload the Training Data
Collect the images of the object you want to detect. Once you have dataset ready in folder images (image files), start uploading the dataset.
python ./code/upload-training.py
Step 7: Train Model
python ./code/train-model.py
Step 8: Get Model State
The model takes ~30 minutes to train. You will get an email once the model is trained. You can check the state of the model using:
watch -n 100 python ./code/model-state.py
Step 9: Make Prediction
python ./code/prediction.py PATH_TO_YOUR_IMAGE.jpg