Data Aggregation: Methods, Benefits, Examples and Automation
Suppose your manager wants to know the travel expense trend by month. You won't send her a file containing individual expense entries, but you'll merge the data every month and then sort it and send it over.
That's the beauty of data aggregation.
Data aggregation is the collection of data from multiple sources and collating it together to draw high-level insights for better decision-making. Data aggregation is a boon for businesses when data overload is common.
In this blog, we will dive deep into data aggregation, how it works, why you should use it, and how to automate it easily.
So, let’s get started.
What is data aggregation?
Data aggregation is organizing, summarizing, and compiling large volumes of information from multiple databases, making it easier for further analysis.
Often when data is aggregated, the multiple rows of information gathered are replaced with parameters like sum, totals, or aggregates for drawing high-level insights like trends. Data aggregation can be applied at any level - from pivot tables to data lakes - ensuring that the data is well-collated and valuable to draw meaningful conclusions.
Data aggregation is used in statistical analysis for large groups of people and creates meaningful data summaries. Data aggregation is usually carried out by software known as data aggregators. These data automation tools collect, process, and summarize the data to present it in a more accessible format.
Want to automate data aggregation? Try Nanonets. Aggregate data from more than 5000 sources on the go!
When should you use data aggregation?
Data aggregation is useful when you have a large dataset that makes no sense unless organized and compacted.
Say you are given a spreadsheet with thousands of rows and hundreds of columns of raw financial expense data; it may make no sense to you. Data aggregation involves converting individual values into parameters like sum, count, average and more to give them meaning.
Data aggregation is handy when:
- You have a large data set that needs to be summarized or reduced to be used properly.
- You want to identify patterns or trends from the data which are not apparent when you see the data in the raw form.
- You want to combine data from multiple sources.
Why should you use data aggregation?
With business requirements increasing, it becomes essential to maintain data in an organized manner, more than ever before. Data is critical to any business. That said, when organizations have to sift across large volumes of data, it becomes more cumbersome if the data isn’t adequately managed and classified.
Data aggregation ensures that data is compiled, summarized, and maintained in an organized fashion, which makes it convenient for the stakeholders to draw actionable insights. Data aggregation makes identifying key trends, patterns, and findings easier, making the information more usable and valuable. The technique enables businesses to achieve their goals by analyzing processes or human assets using features like searching, collecting, and presenting the data in a summarized, report-based format.
How to do data aggregation? - Step-by-step approach
Data aggregation follows simple steps. You can either do it manually or use a platform like Nanonets to automate all the steps. Basically, data aggregation combines multiple rows of data from different sources, processes the data, and then summarizes it for better statistical analysis.
Let's look at several steps involved in the data aggregation process. These include:
Data Collection:
Data aggregators extract data in small rows from various sources, storing it in large databases. The sources for data collection can be anything you want:
- Gmail - attachments or emails
- Desktop files & folders
- Databases like MySQL
Before analysis, you must perform data wrangling, data cleansing, and more to ensure data uniformity. There are different ways to aggregate data, depending on the data volume.
- In-network aggregation: This uses a multi-hop system for gathering and transmitting information.
- Tree-based approach: An aggregation tree is created and mapped in a way that data is put from leaves to roots, as the source and sink nodes
- Cluster-based aggregation: This involves collating large volumes of data on the entire network
- Multi-path aggregation: Under this method, partially aggregated data is sent to the root or parent node, from where it sends the data to different routes
Next, you must choose the level of data refresh you want.
- Reporting period refers to the period over which the data is collected. It could be weekly, monthly, annually, etc. Besides, the reporting period may include raw or aggregated data.
- Granularity: This is the period for which data points for a resource are collected for aggregation. For example, if an organization wants to find the average of data points over a 15-minute interval, then the granularity is 15 minutes.
- Polling Period: It refers to the duration of time that specifies how often resources are used for sample data. Say a resource is polled every 15 minutes; that means the data point is generated for the resource every 15 minutes.
Mathematical functions play a significant role in data aggregation. Some of the commonly used functions include:
- Average: This function computes the average of all the data points in a set
- Max: This function returns the highest value in a given set or category
- Min: This function returns the lowest value in a given set or category
- Sum: This function provides the sum or total of all the data points in a set
- Count: This function returns the total number of datasets in a given data set
Data Processing:
The next step in data aggregation is data processing.
Once you've collected the data, you can use predictive analytics, artificial intelligence, and machine learning algorithms on the collected data to draw meaningful insights.
Finally, the data aggregation software can apply specific statistical functions to aggregate the data
Data Visualization:
The last stage in data aggregation is presenting the processed data in a consumable form. Many high-quality data visualization tools let users show the data in a more summarized, organized, and understandable manner.
Data aggregation can be conducted manually or using automated data platforms. However, data aggregation usually occurs on a large scale involving vast volumes of data. That said, applying a manual procedure may not be feasible as it is prone to accidentally omitting important data patterns or sources.
Want to automate repetitive data tasks? Check out Nanonets to perform any data aggregation task on autopilot!
How to automate data aggregation?
You can set the entire data aggregation process on automation using simple no-code workflows. Multiple data automation platforms, like Nanonets, can quickly automate document data aggregation on a large scale.
On Nanonets, you can set up data aggregation easily:
Login or create a free account on Nanonets
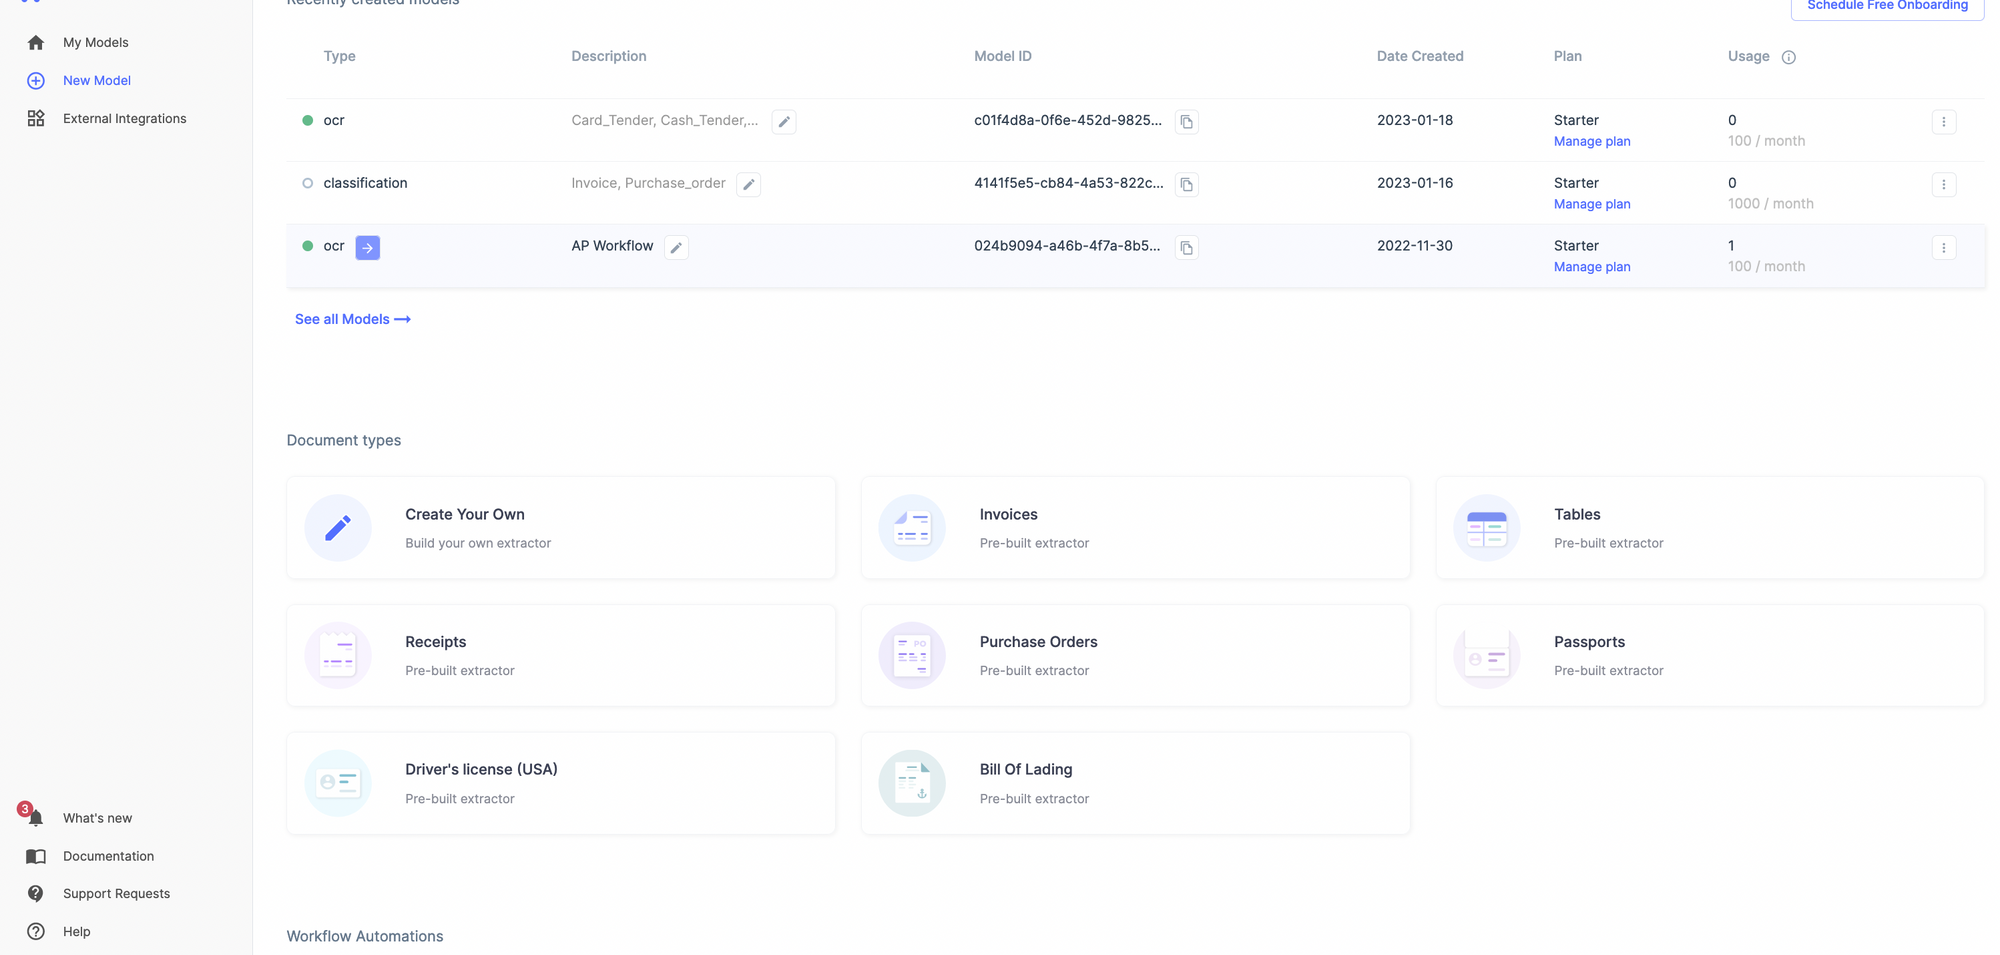
Select the kind of document you want to extract data from - a receipt, bill, or create your custom model.
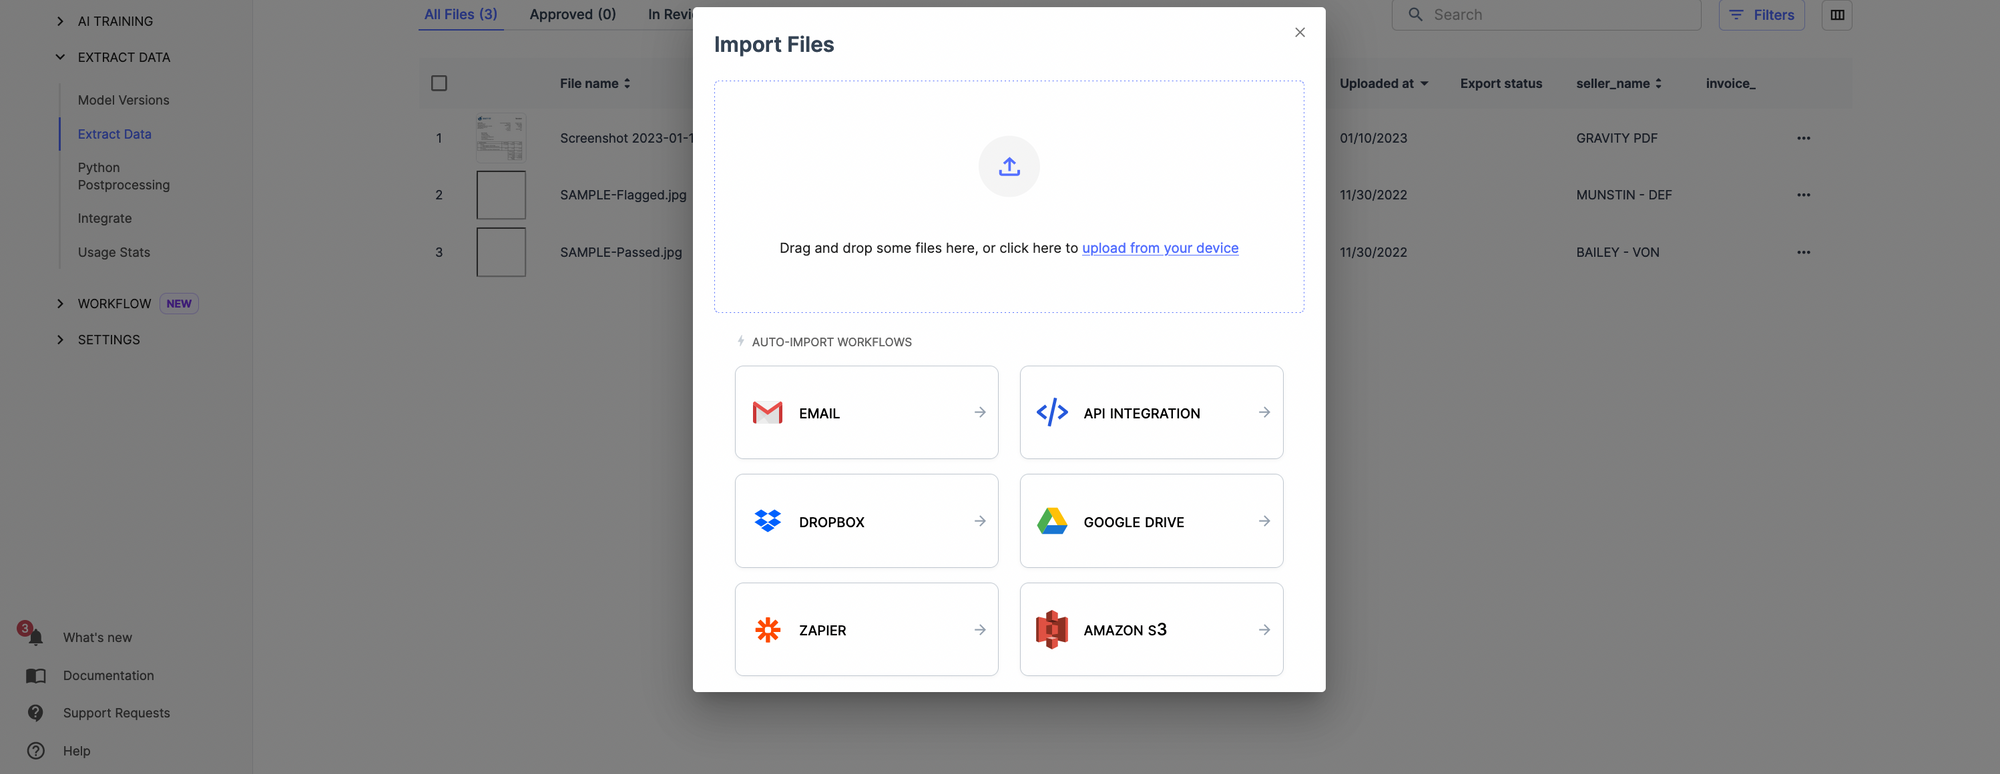
Automatically collect the document using the document import options. Once this is done, your documents will be automatically uploaded on Nanonets, and you can extract relevant data from documents.
You can set up the frequency of document upload via settings.
Now comes rules. What do you want to do with the data? You can set up rule-based no-code workflows to do many tasks like date formatting, lookup in the database, matching the data, removing commas, capitalizing the data, and more.
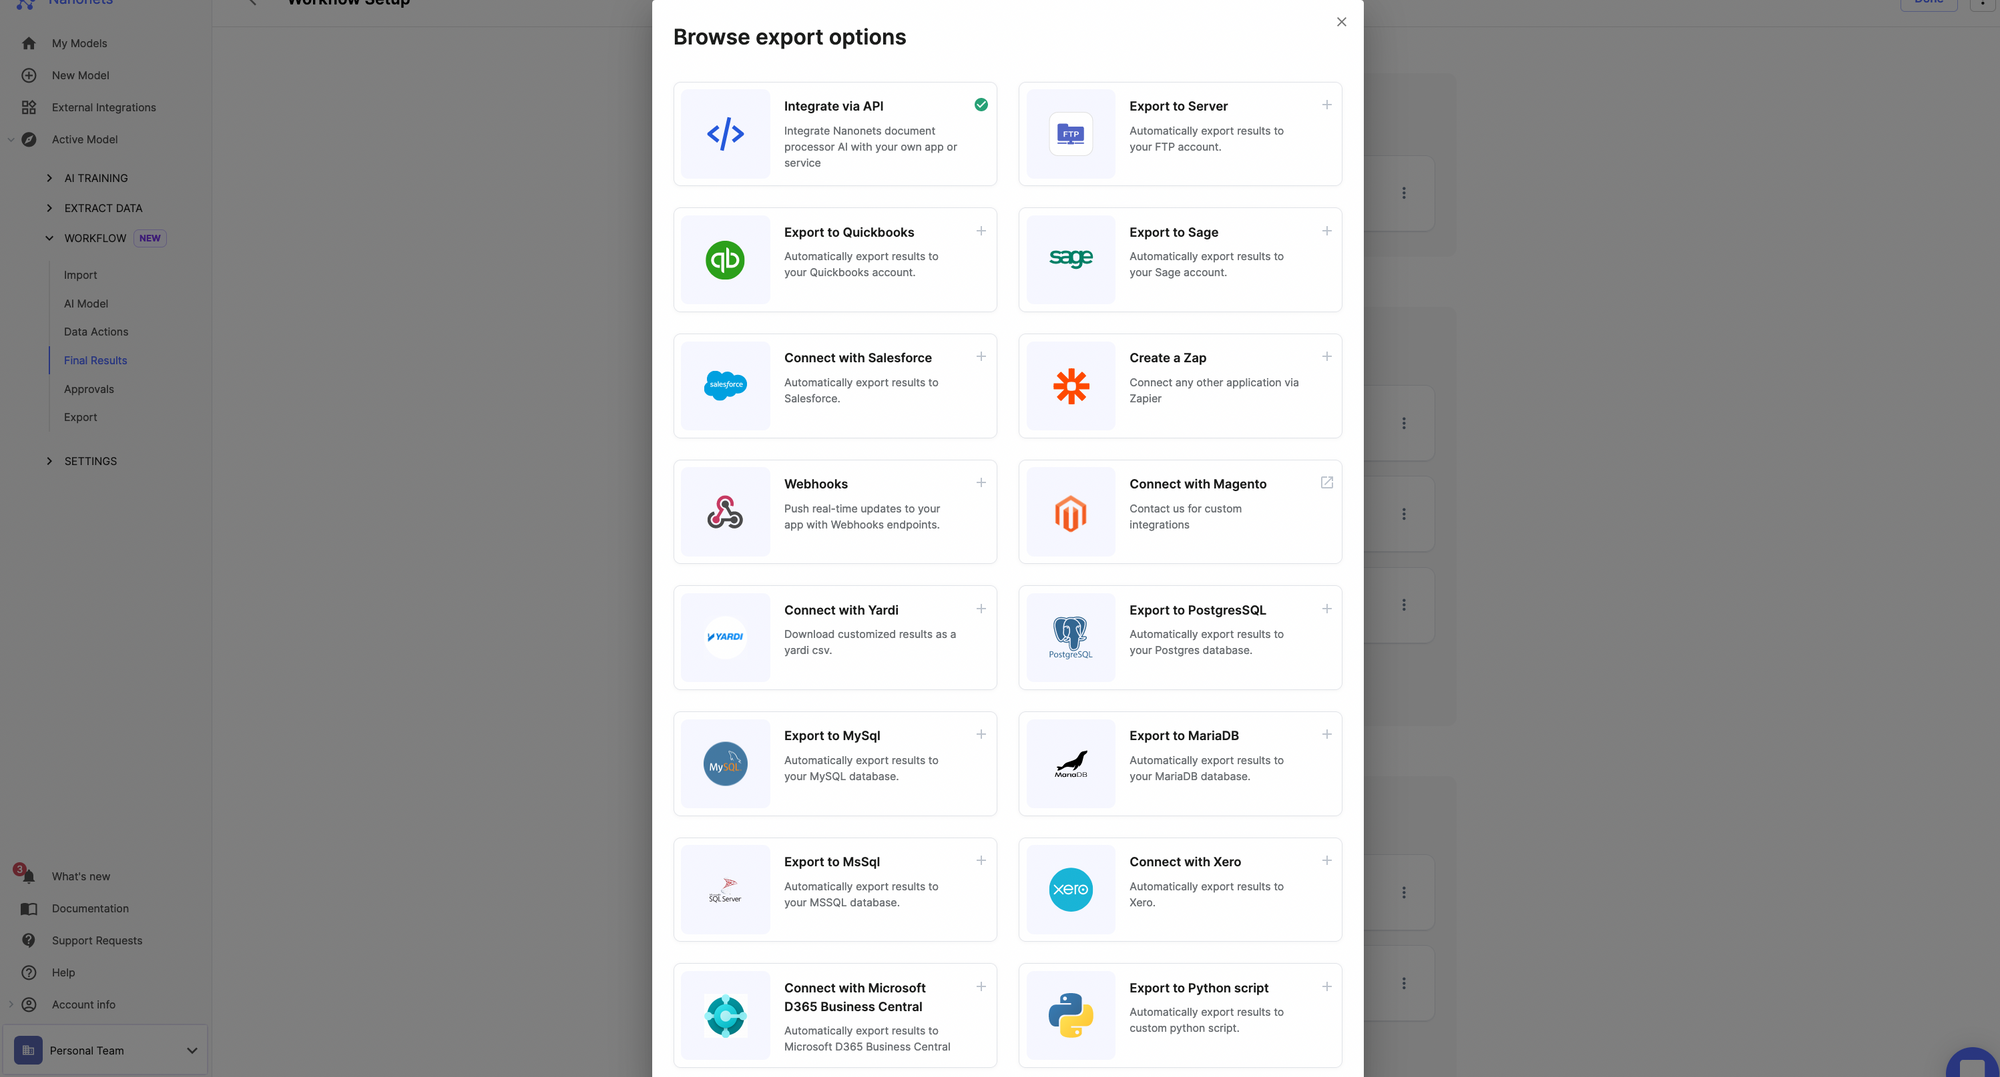
Once you've processed the data, you can share the data with your business applications using data export options on Nanonets.
It's very straightforward to set up data aggregation on Nanonets. You can start doing it yourself or reach out to our experts, who can help you set up workflows for your use case.
Data aggregation for enterprises
Data aggregation is an integral component of enterprises in the era of growing business needs. Data aggregation offers multiple benefits to enterprises. For example, you may have a lot of data. However, not everything needs to be analyzed. That said, data aggregation first checks which data needs analysis and chooses them.
This ensures that only relevant data is taken into consideration for aggregation. In addition, data aggregation facilitates competitor research and helps organizations leverage business intelligence to derive useful outcomes. Plus, it helps with a lot of use cases like:
- Business Intelligence: Aggregating data from multiple sources such as sales figures, customer demographics, and market trends to gain insights and make strategic business decisions. For example, a retail company may aggregate data from their point-of-sale systems, customer loyalty program, and market research surveys to identify their most profitable products, customer segments, and marketing strategies.
- Website Analytics: Aggregating data from website logs and tracking tools to understand user behavior and improve website performance. For example, a website owner may aggregate data from Google Analytics, heatmaps, and A/B testing tools to identify the most popular pages, the most effective calls-to-action, and the best performing variations of a website.
- Network Monitoring: Aggregating data from network devices and security systems to identify and troubleshoot network issues and detect security breaches. For example, a network administrator may aggregate data from routers, switches, firewalls, and intrusion detection systems to identify the cause of a network outage, identify the source of a security threat, and generate performance reports.
- Financial Analytics: Aggregating data from various financial systems and tools to support portfolio management and risk management. For example, a financial institution may aggregate data from trading systems, market data feeds, and risk management platforms to generate performance reports, identify market trends, and measure the risk of its portfolio.
Why should you go for data aggregation automation?
Data aggregation can be done manually or automatically. Automated data aggregation is usually preferred because it can handle large volumes of data, reducing the risk of errors. Platforms like Nanonets, can unify large sets of data from multiple sources and make it easy to perform data analytics.
For example, if you use data aggregation automation for marketing purposes, the system will gather data from various sources such as Ad platforms, social media, and website analytics. The system then normalizes the data using harmonization techniques, which eliminates duplicates, reduces redundancies, aligns distinct indicators and removes data discrepancies.
Finally, the data is stored in a centralized location, such as an analytical database, which can handle large datasets. This makes it easier for data analysts to gain meaningful insights from the data.
Conclusion
Data aggregation is a potent tool that validates, organizes, summarizes, and presents data in an easily understandable view. The technique finds applications across healthcare, finance, banking, advertising, and more.
Businesses need to adopt data aggregation in order to eliminate data silos and use data efficiently for developing their business strategies. But, it's easier said than done. You need to select the best tool in order to fit your use case.
Do you have a usecase in mind? Find out how Nanonets' can help you automate data tasks. You can start your free trial or reach out to our automation experts.
Read more about data processing on Nanonets:


